Page 69 - Annual report eng 2019
P. 69

Tycoons Worldwide Group (Thailand) Plc.


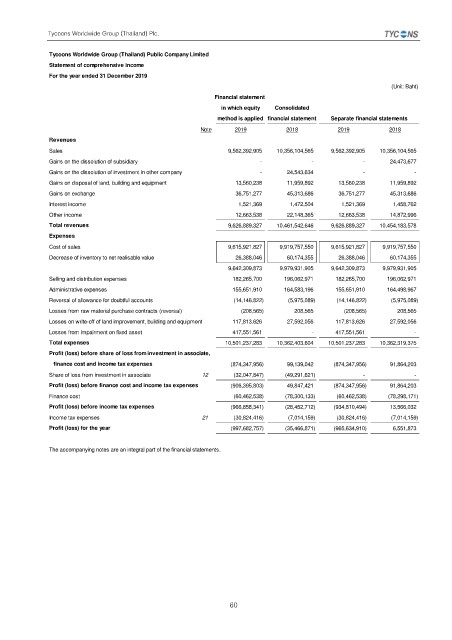
              Tycoons Worldwide Group (Thailand) Public Company Limited
              Statement of comprehensive income
              For the year ended 31 December 2019
                                                                                                        (Unit: Baht)
                                                          Financial statement
                                                           in which equity  Consolidated
                                                          method is applied financial statement  Separate financial statements
                                                      Note     2019         2018          2019          2018
              Revenues
              Sales                                                9,562,392,905        10,356,104,565          9,562,392,905        10,356,104,565
              Gains on the dissolution of subsidiary                                     -                                -                                -               24,473,677
              Gains on the dissolution of investment in other company                                -               24,543,634                                -                                -
              Gains on disposal of land, building and equipment               13,560,238               11,959,892               13,560,238               11,959,892
              Gains on exchange                                         36,751,277               45,313,686               36,751,277               45,313,686
              Interest income                                             1,521,369                 1,472,504                 1,521,369                 1,458,762
              Other income                                              12,663,538               22,148,365               12,663,538               14,872,996
              Total revenues                                       9,626,889,327        10,461,542,646          9,626,889,327        10,454,183,578
              Expenses
              Cost of sales                                        9,615,921,827          9,919,757,550          9,615,921,827          9,919,757,550
              Decrease of inventory to net realisable value                26,388,046               60,174,355               26,388,046               60,174,355
                                                                   9,642,309,873          9,979,931,905          9,642,309,873          9,979,931,905
              Selling and distribution expenses                       182,265,700             196,062,971             182,265,700             196,062,971
              Administrative expenses                                 155,651,910             164,583,196             155,651,910             164,498,967
              Reversal of allowance for doubtful accounts               (14,146,822)                (5,975,089)              (14,146,822)                (5,975,089)
              Losses from raw material purchase contracts (reversal)                   (208,565)                    208,565                   (208,565)                    208,565
              Losses on write-off of land improvement, building and equipment             117,813,626               27,592,056             117,813,626               27,592,056
              Losses from impairment on fixed asset                   417,551,561                                -             417,551,561                                -
              Total expenses                                     10,501,237,283        10,362,403,604        10,501,237,283        10,362,319,375
              Profit (loss) before share of loss from investment in associate,
                 finance cost and income tax expenses                (874,347,956)               99,139,042            (874,347,956)               91,864,203
              Share of loss from investment in associate  12              (32,047,847)              (49,291,621)                                -                                -
              Profit (loss) before finance cost and income tax expenses    (906,395,803)  49,847,421  (874,347,956)  91,864,203
              Finance cost                                             (60,462,538)              (78,300,133)              (60,462,538)              (78,298,171)
              Profit (loss) before income tax expenses               (966,858,341)              (28,452,712)            (934,810,494)               13,566,032
              Income tax expenses                     21               (30,824,416)                (7,014,159)              (30,824,416)                (7,014,159)
              Profit (loss) for the year                             (997,682,757)              (35,466,871)            (965,634,910)                 6,551,873

              The accompanying notes are an integral part of the financial statements.


                                                              60
   64   65   66   67   68   69   70   71   72   73   74