
Page 76 - Annual report eng 2019
P. 76
Tycoons Worldwide Group (Thailand) Plc.
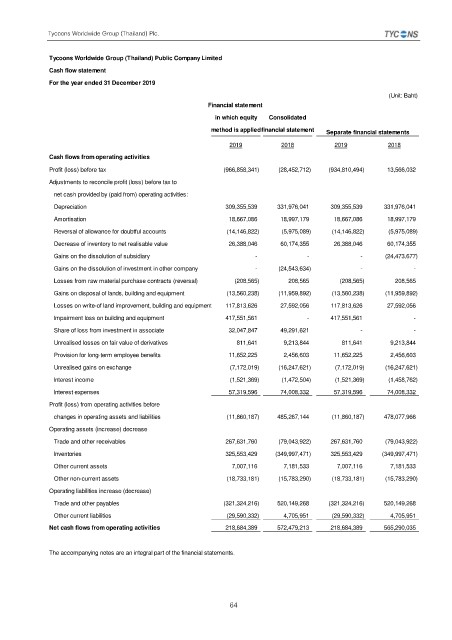
Tycoons Worldwide Group (Thailand) Public Company Limited
Cash flow statement
For the year ended 31 December 2019
(Unit: Baht)
Financial statement
in which equity Consolidated
method is appliedfinancial statement Separate financial statements
2019 2018 2019 2018
Cash flows from operating activities
Profit (loss) before tax (966,858,341) (28,452,712) (934,810,494) 13,566,032
Adjustments to reconcile profit (loss) before tax to
net cash provided by (paid from) operating activities:
Depreciation 309,355,539 331,976,041 309,355,539 331,976,041
Amortisation 18,667,086 18,997,179 18,667,086 18,997,179
Reversal of allowance for doubtful accounts (14,146,822) (5,975,089) (14,146,822) (5,975,089)
Decrease of inventory to net realisable value 26,388,046 60,174,355 26,388,046 60,174,355
Gains on the dissolution of subsidiary - - - (24,473,677)
Gains on the dissolution of investment in other company - (24,543,634) - -
Losses from raw material purchase contracts (reversal) (208,565) 208,565 (208,565) 208,565
Gains on disposal of lands, building and equipment (13,560,238) (11,959,892) (13,560,238) (11,959,892)
Losses on write-of land improvement, building and equipment 117,813,626 27,592,056 117,813,626 27,592,056
Impairment loss on building and equipment 417,551,561 - 417,551,561 -
Share of loss from investment in associate 32,047,847 49,291,621 - -
Unrealised losses on fair value of derivatives 811,641 9,213,844 811,641 9,213,844
Provision for long-term employee benefits 11,652,225 2,456,603 11,652,225 2,456,603
Unrealised gains on exchange (7,172,019) (16,247,621) (7,172,019) (16,247,621)
Interest income (1,521,369) (1,472,504) (1,521,369) (1,458,762)
Interest expenses 57,319,596 74,008,332 57,319,596 74,008,332
Profit (loss) from operating activities before
changes in operating assets and liabilities (11,860,187) 485,267,144 (11,860,187) 478,077,966
Operating assets (increase) decrease
Trade and other receivables 267,631,760 (79,043,922) 267,631,760 (79,043,922)
Inventories 325,553,429 (349,997,471) 325,553,429 (349,997,471)
Other current assets 7,007,116 7,181,533 7,007,116 7,181,533
Other non-current assets (18,733,181) (15,783,290) (18,733,181) (15,783,290)
Operating liabilities increase (decrease)
Trade and other payables (321,324,216) 520,149,268 (321,324,216) 520,149,268
Other current liabilities (29,590,332) 4,705,951 (29,590,332) 4,705,951
Net cash flows from operating activities 218,684,389 572,479,213 218,684,389 565,290,035
The accompanying notes are an integral part of the financial statements.
64