
Page 95 - Annual report eng 2019
P. 95
Tycoons Worldwide Group (Thailand) Plc.
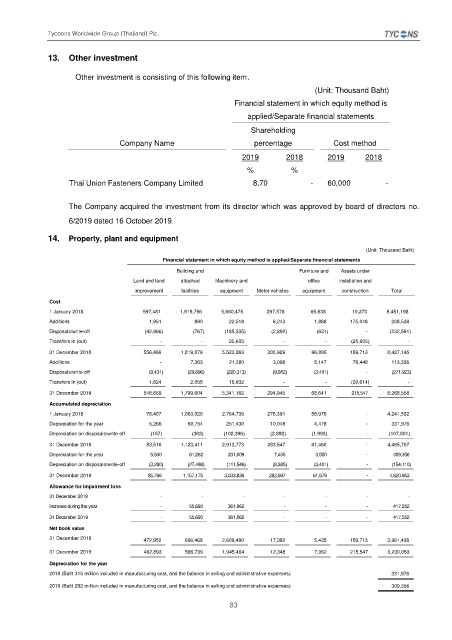
13. Other investment
Other investment is consisting of this following item.
(Unit: Thousand Baht)
Financial statement in which equity method is
applied/Separate financial statements
Shareholding
Company Name percentage Cost method
2019 2018 2019 2018
% %
Thai Union Fasteners Company Limited 8.70 - 60,000 -
The Company acquired the investment from its director which was approved by board of directors no.
6/2019 dated 16 October 2019.
14. Property, plant and equipment
(Unit: Thousand Baht)
Financial statement in which equity method is applied/Separate financial statements
Building and Furniture and Assets under
Land and land attached Machinery and office installation and
improvement facilities equipment Motor vehicles equipment construction Total
Cost
1 January 2018 597,481 1,819,756 5,660,475 297,578 65,638 10,270 8,451,198
Additions 1,951 890 22,518 6,243 1,888 175,048 208,538
Disposals/write-off (42,966) (767) (185,335) (2,892) (631) - (232,591)
Transfers in (out) - - 25,605 - - (25,605) -
31 December 2018 556,466 1,819,879 5,523,263 300,929 66,895 159,713 8,427,145
Additions - 7,363 21,280 3,098 5,147 76,448 113,336
Disposals/write-off (9,431) (29,696) (220,313) (9,082) (3,401) - (271,923)
Transfers in (out) 1,624 2,058 16,932 - - (20,614) -
31 December 2019 548,659 1,799,604 5,341,162 294,945 68,641 215,547 8,268,558
Accumulated depreciation
1 January 2018 78,407 1,063,020 2,764,739 276,391 58,975 - 4,241,532
Depreciation for the year 5,266 60,754 251,430 10,048 4,478 - 331,976
Depreciation on disposals/write-off (157) (363) (102,396) (2,892) (1,993) - (107,801)
31 December 2018 83,516 1,123,411 2,913,773 283,547 61,460 - 4,465,707
Depreciation for the year 5,530 61,262 231,609 7,435 3,520 - 309,356
Depreciation on disposals/write-off (3,280) (27,498) (111,546) (8,385) (3,401) - (154,110)
31 December 2019 85,766 1,157,175 3,033,836 282,597 61,579 - 4,620,953
Allowance for impairment loss
31 December 2018 - - - - - - -
Increase during the year - 55,690 361,862 - - - 417,552
31 December 2019 - 55,690 361,862 - - - 417,552
Net book value
31 December 2018 472,950 696,468 2,609,490 17,382 5,435 159,713 3,961,438
31 December 2019 462,893 586,739 1,945,464 12,348 7,062 215,547 3,230,053
Depreciation for the year
2018 (Baht 315 million included in manufacturing cost, and the balance in selling and administrative expenses) 331,976
2019 (Baht 292 million included in manufacturing cost, and the balance in selling and administrative expenses) 309,356
83