Page 13 - Annual report eng 2020
P. 13

Tycoons Worldwide Group (Thailand) Plc.


                            process  of  annealed  wire.  Actual  capacity  will  be  lower,  at  approximately  108,000
                            tons/years, if it were produce over a single process of annealed wire.

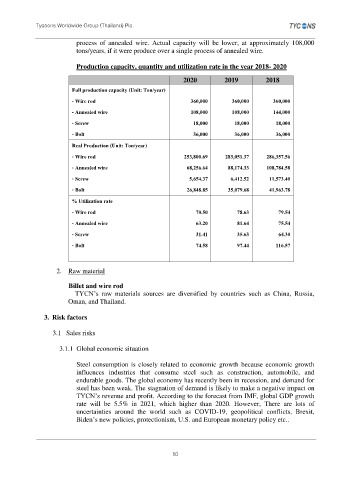
                            Production capacity, quantity and utilization rate in the year 2018- 2020

                                                                 2020           2019          2018
                          Full production capacity (Unit: Ton/year)
                          - Wire rod                                360,000       360,000        360,000
                          - Annealed wire                           108,000       108,000        144,000

                          - Screw                                    18,000        18,000         18,000
                          - Bolt                                     36,000        36,000         36,000

                          Real Production (Unit: Ton/year)
                          - Wire rod                              253,800.69    283,051.37     286,357.56

                          - Annealed wire                          68,256.64     88,174.33     108,784.58
                          - Screw                                   5,654.37      6,412.52      11,573.40
                          - Bolt                                   26,848.85     35,079.68      41,963.78

                          % Utilization rate
                          - Wire rod                                  70.50         78.63          79.54

                          - Annealed wire                             63.20         81.64          75.54
                          - Screw                                     31.41         35.63          64.30

                          - Bolt                                      74.58         97.44         116.57


                     2.  Raw material

                         Billet and wire rod
                             TYCN’s  raw  materials  sources  are  diversified  by  countries  such  as  China,  Russia,
                         Oman, and Thailand.

                 3.  Risk factors

                      3.1   Sales risks

                          3.1.1  Global economic situation

                                    Steel  consumption is  closely related to  economic  growth  because economic  growth
                            influences  industries  that  consume  steel  such  as  construction,  automobile,  and
                            endurable goods. The global economy has recently been in recession, and demand for
                            steel has been weak. The stagnation of demand is likely to make a negative impact on
                            TYCN’s revenue and profit. According to the forecast from IMF, global GDP growth
                            rate  will  be  5.5%  in  2021,  which  higher  than  2020.  However,  There  are  lots  of
                            uncertainties  around  the  world  such  as  COVID-19,  geopolitical  conflicts,  Brexit,
                            Biden’s new policies, protectionism, U.S. and European monetary policy etc..


                                                              10
   8   9   10   11   12   13   14   15   16   17   18